This approach applies a spatial computing approach to analyze rock joint orientations using point cloud data generated from Agisoft Metashape. A KD-tree (k-dimensional tree) data structure is utilized to efficiently organize and query 3D points, enabling rapid nearest-neighbor searches across complex rock surfaces.
By processing the local spatial distribution of points, the algorithm automatically computes the dip and dip direction of each joint plane. This method provides a faster, more consistent, and reproducible alternative to conventional manual measurements, offering valuable support for geotechnical and structural analyses, including slope stability assessment and subsurface structural modeling.
I Have Succesfully implemented this method in a quarry at one of Indonesian Nickel Mine
Step 1 – Point Cloud Generation through Photogrammetry
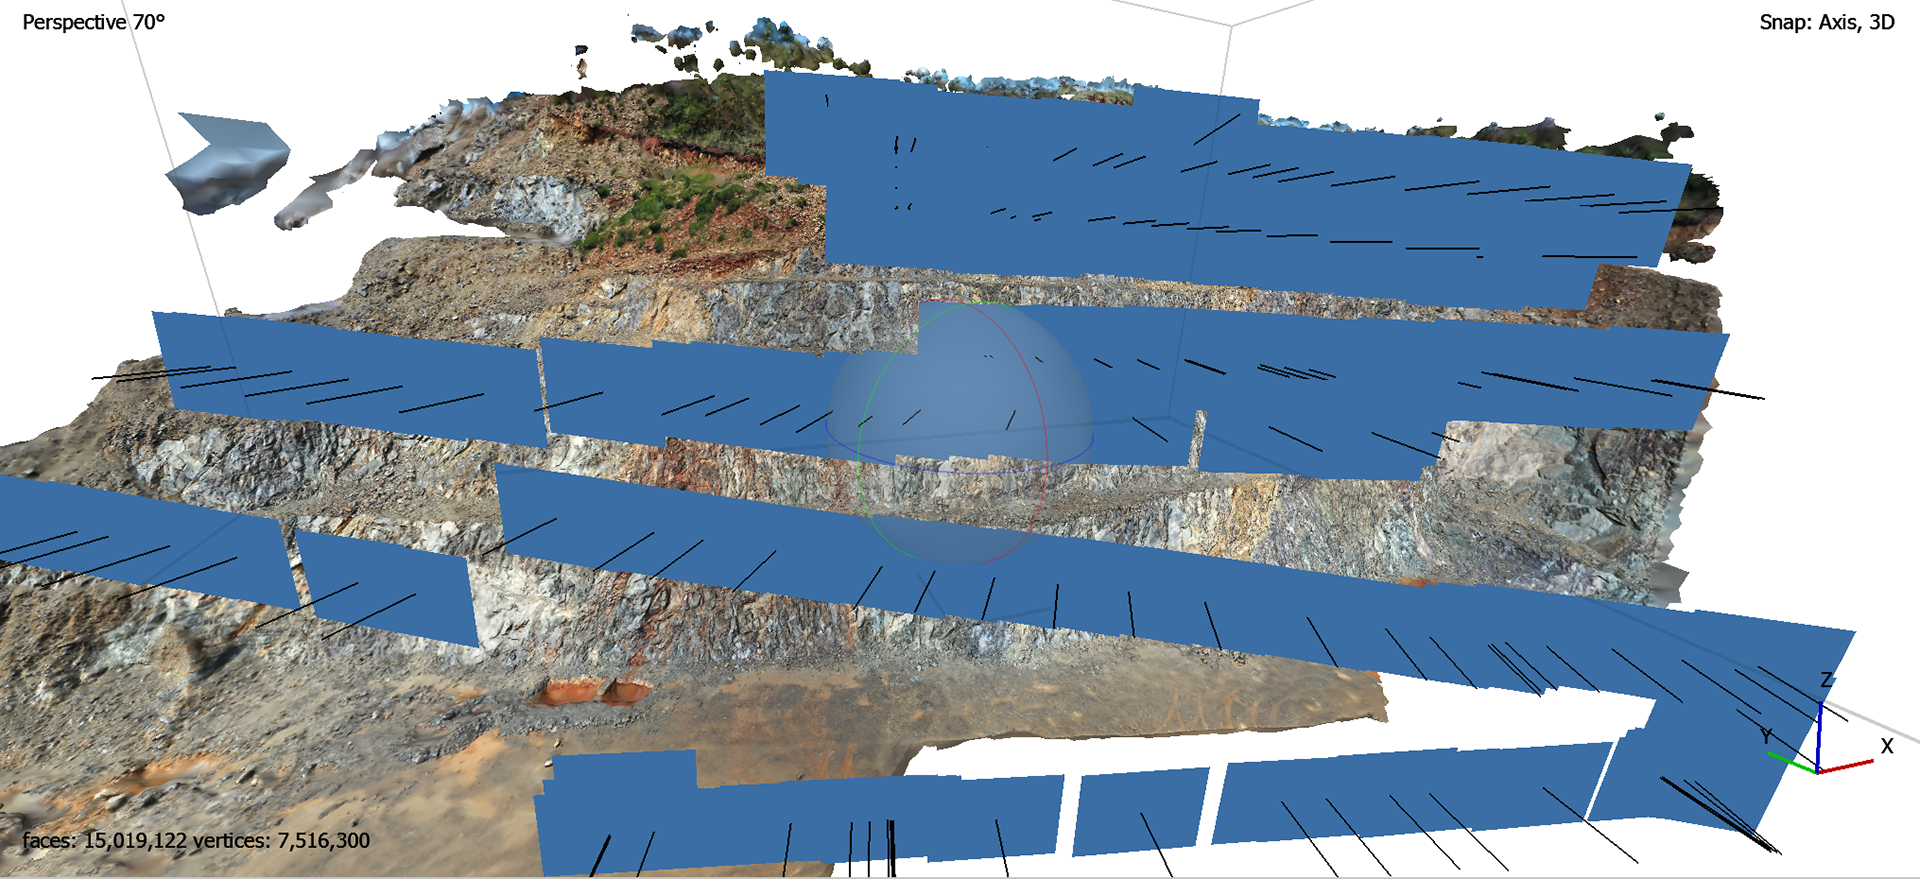
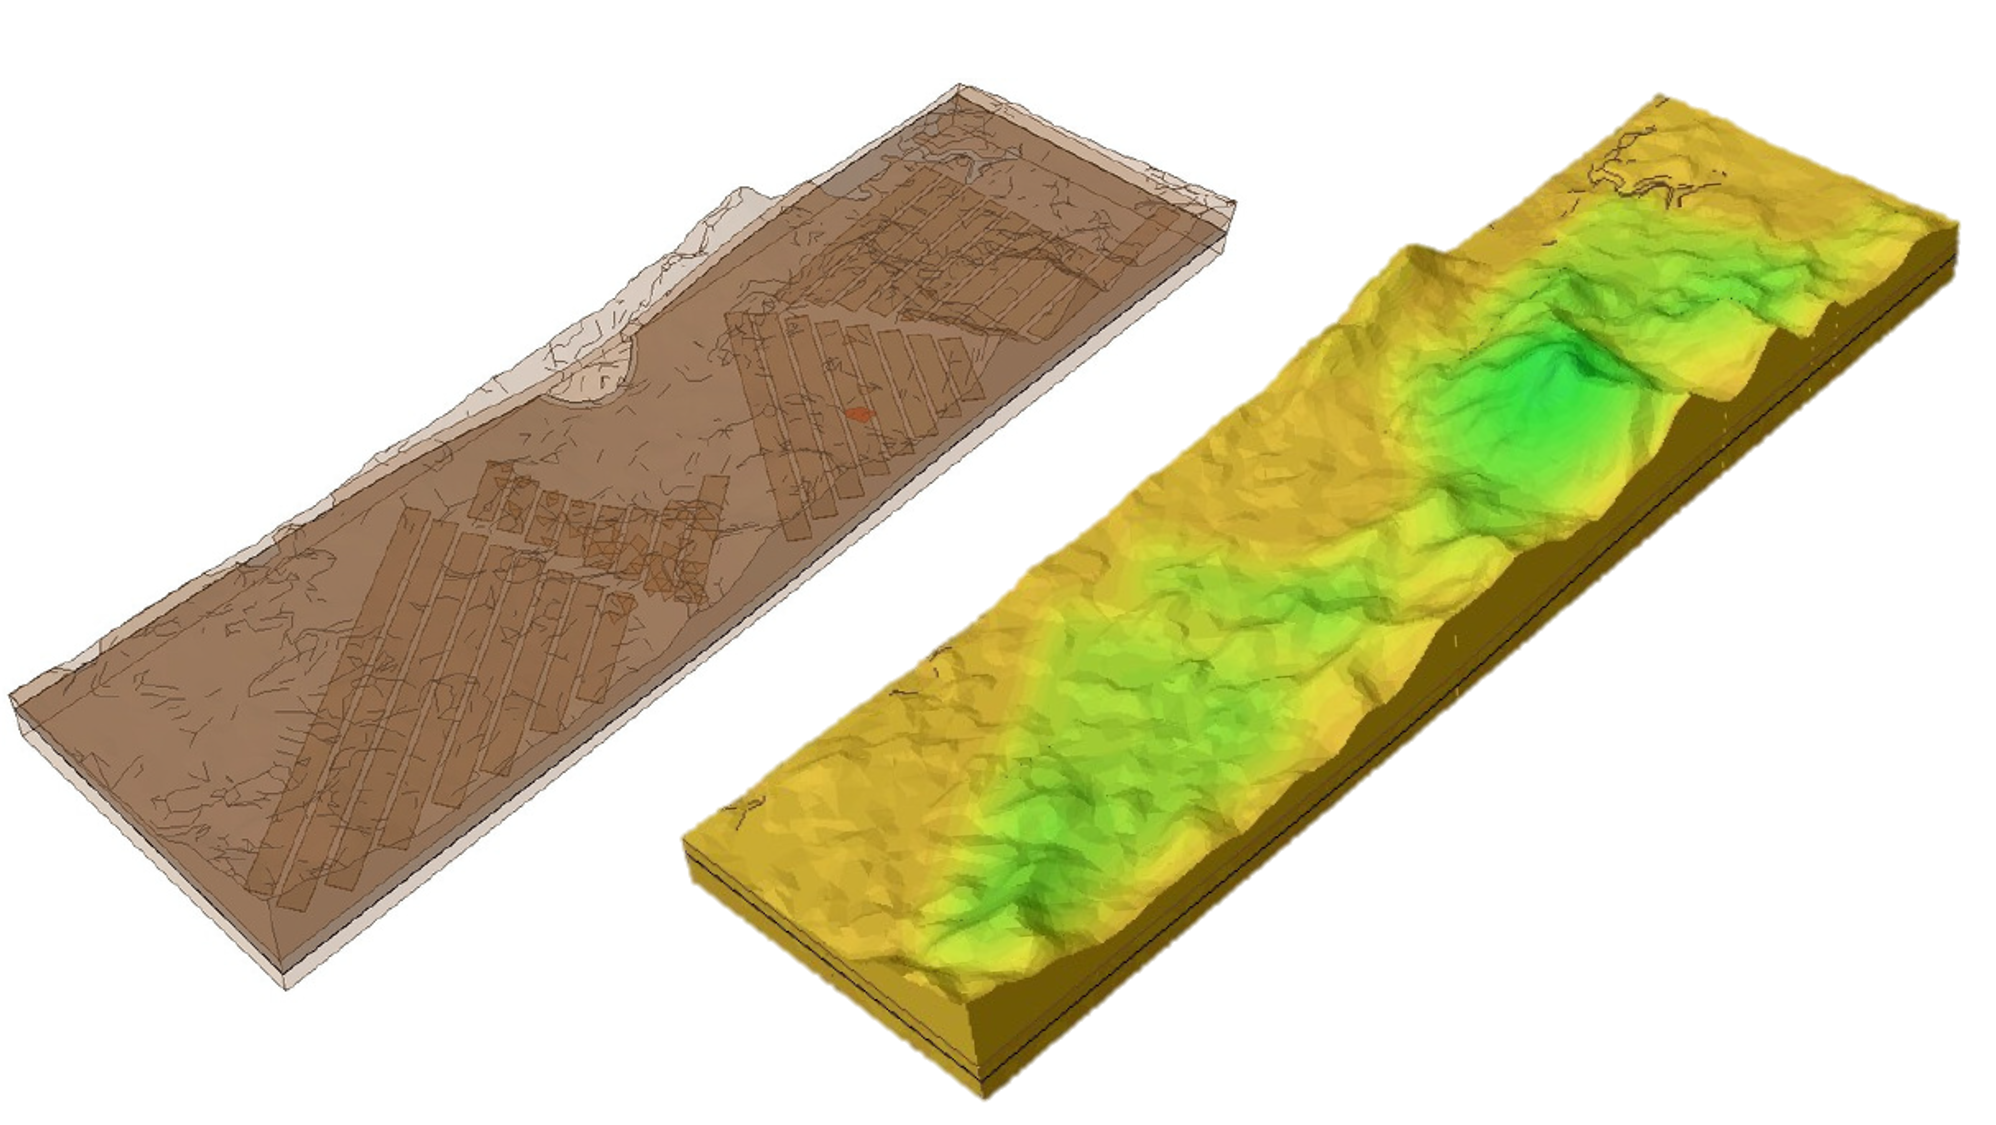
High-resolution photographs of the rock slope were captured from the front view to ensure that joint surfaces were clearly visible. These images were then processed using Agisoft Metashape to generate a detailed 3D point cloud representing the slope geometry. The photogrammetric approach provides accurate spatial data and realistic surface textures, forming the foundation for subsequent structural and joint set analyses.
Step 2 – Structural Analysis Using KD-Tree
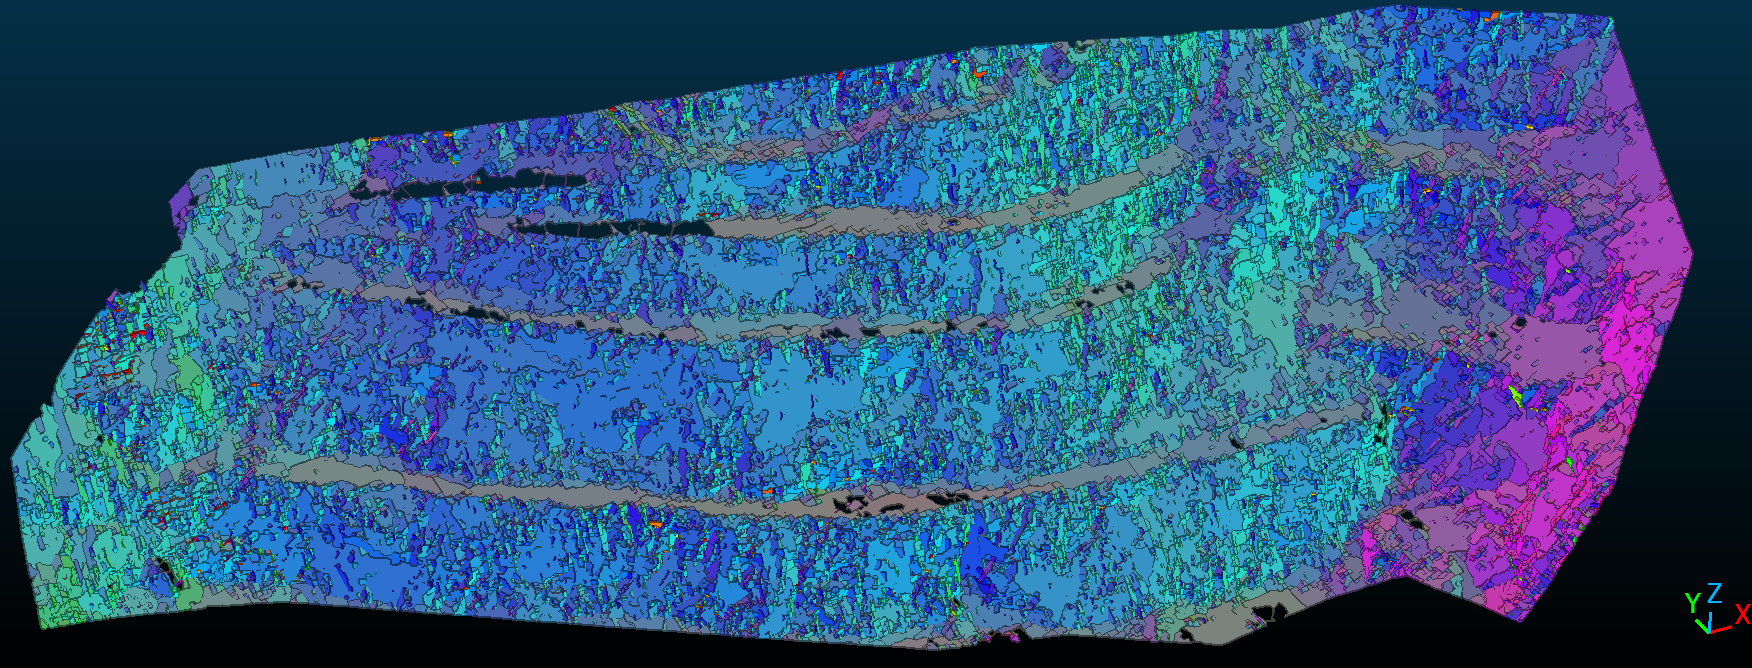
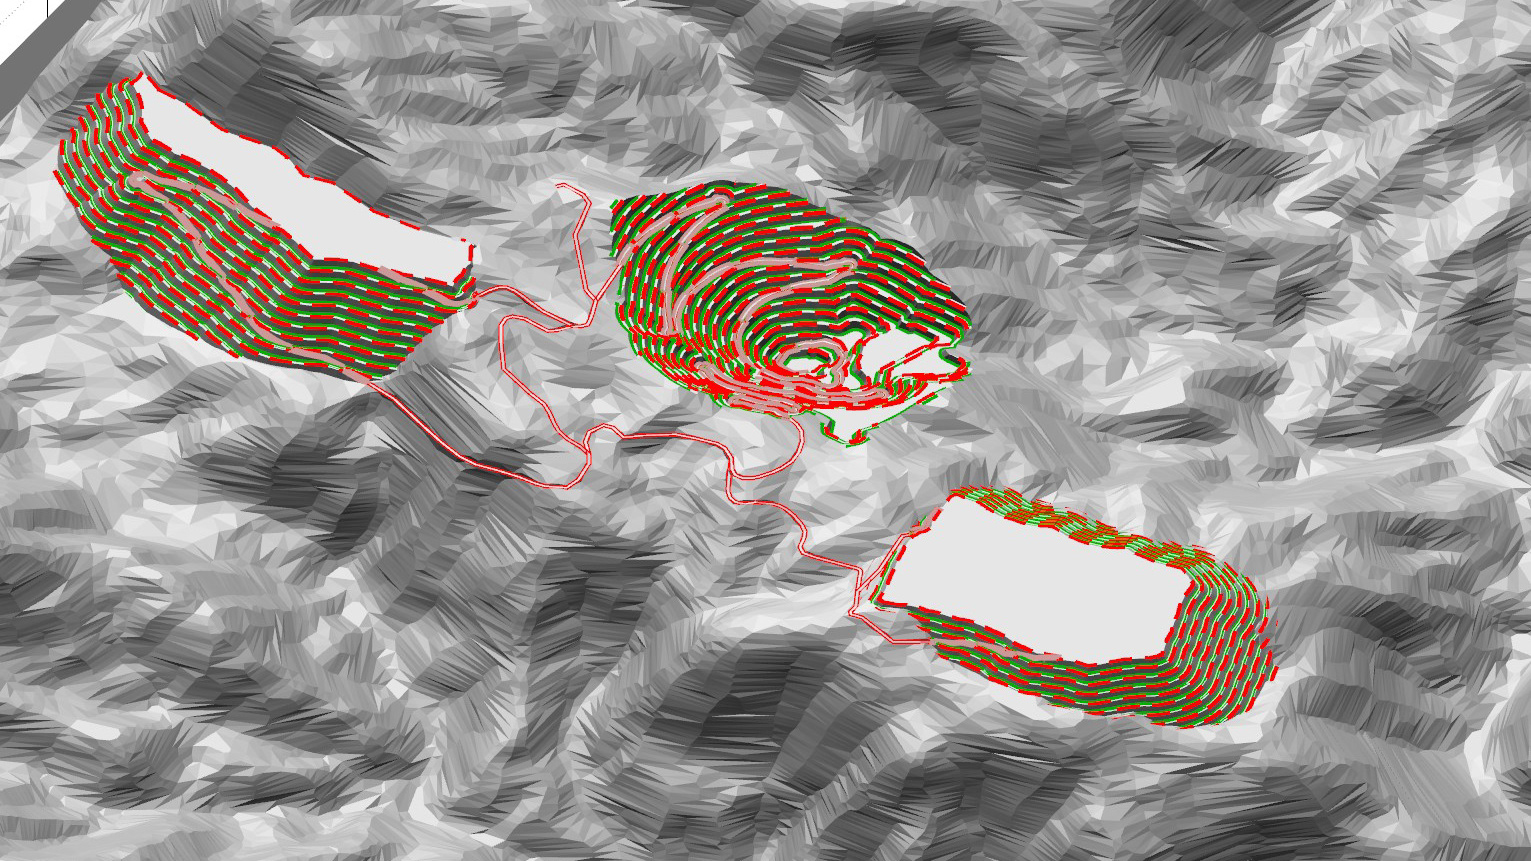
The Photogrammetry result is exported as point cloud. The KD-tree algorithm was applied to analyze the spatial relationships among points within the 3D cloud. This method identifies local neighborhoods to estimate the orientation of joint planes, allowing automatic calculation of dip and dip direction values. The adjustable RMS error parameter controls the fitting tolerance, allowing flexibility to match different rock mass characteristics. For more intact or less fractured rock masses, a relatively larger RMS value can be used, while blocky or highly jointed rocks require a smaller RMS to maintain fitting precision.
3. Result in dip/dip-direction stereonet
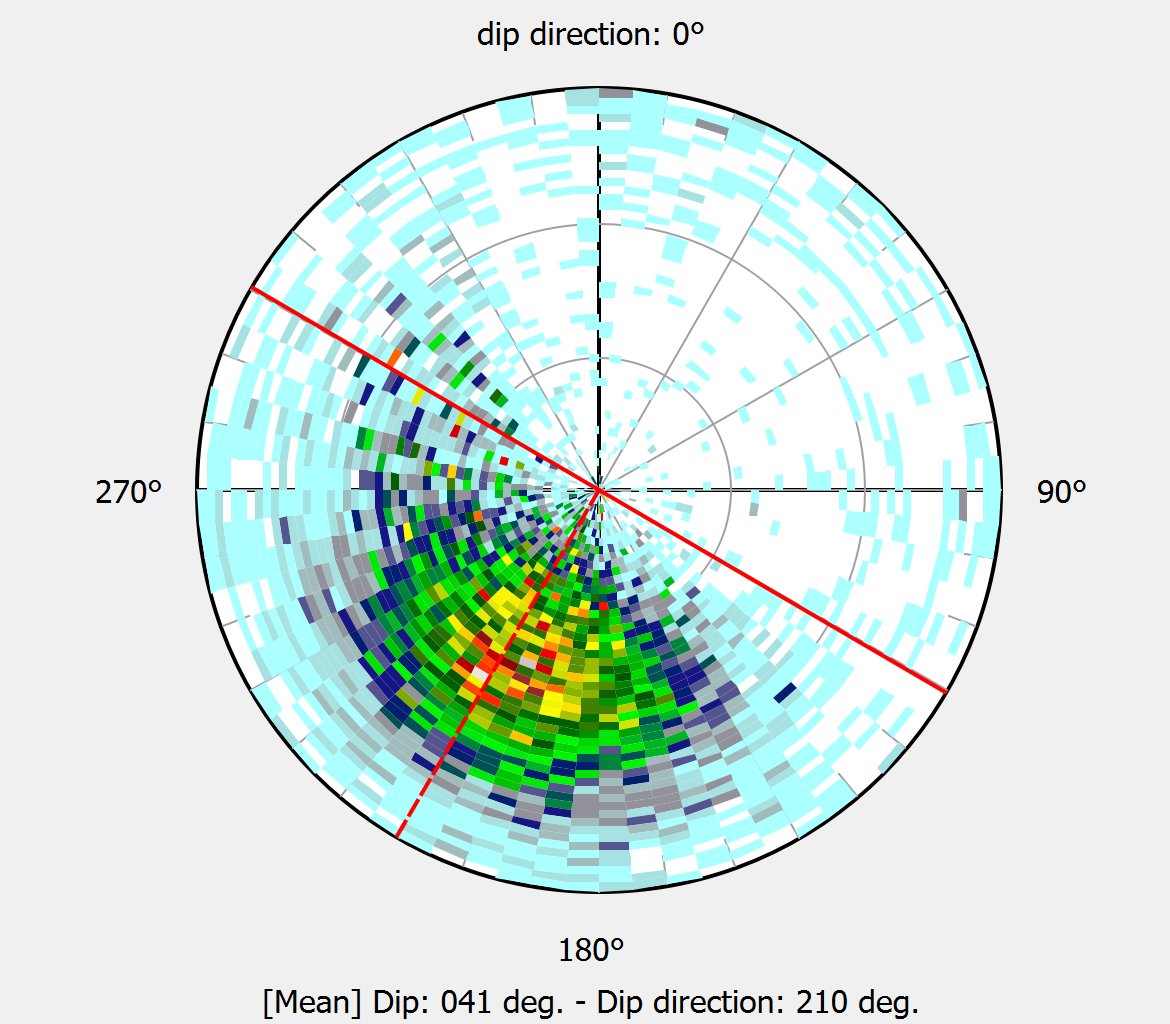
The orientation data derived from the KD-tree analysis were visualized using a stereonet to represent the spatial distribution of joint planes. This graphical projection allows clear identification of dominant joint sets and their respective structural trends.
4. Result Intepretation to define the slope stability
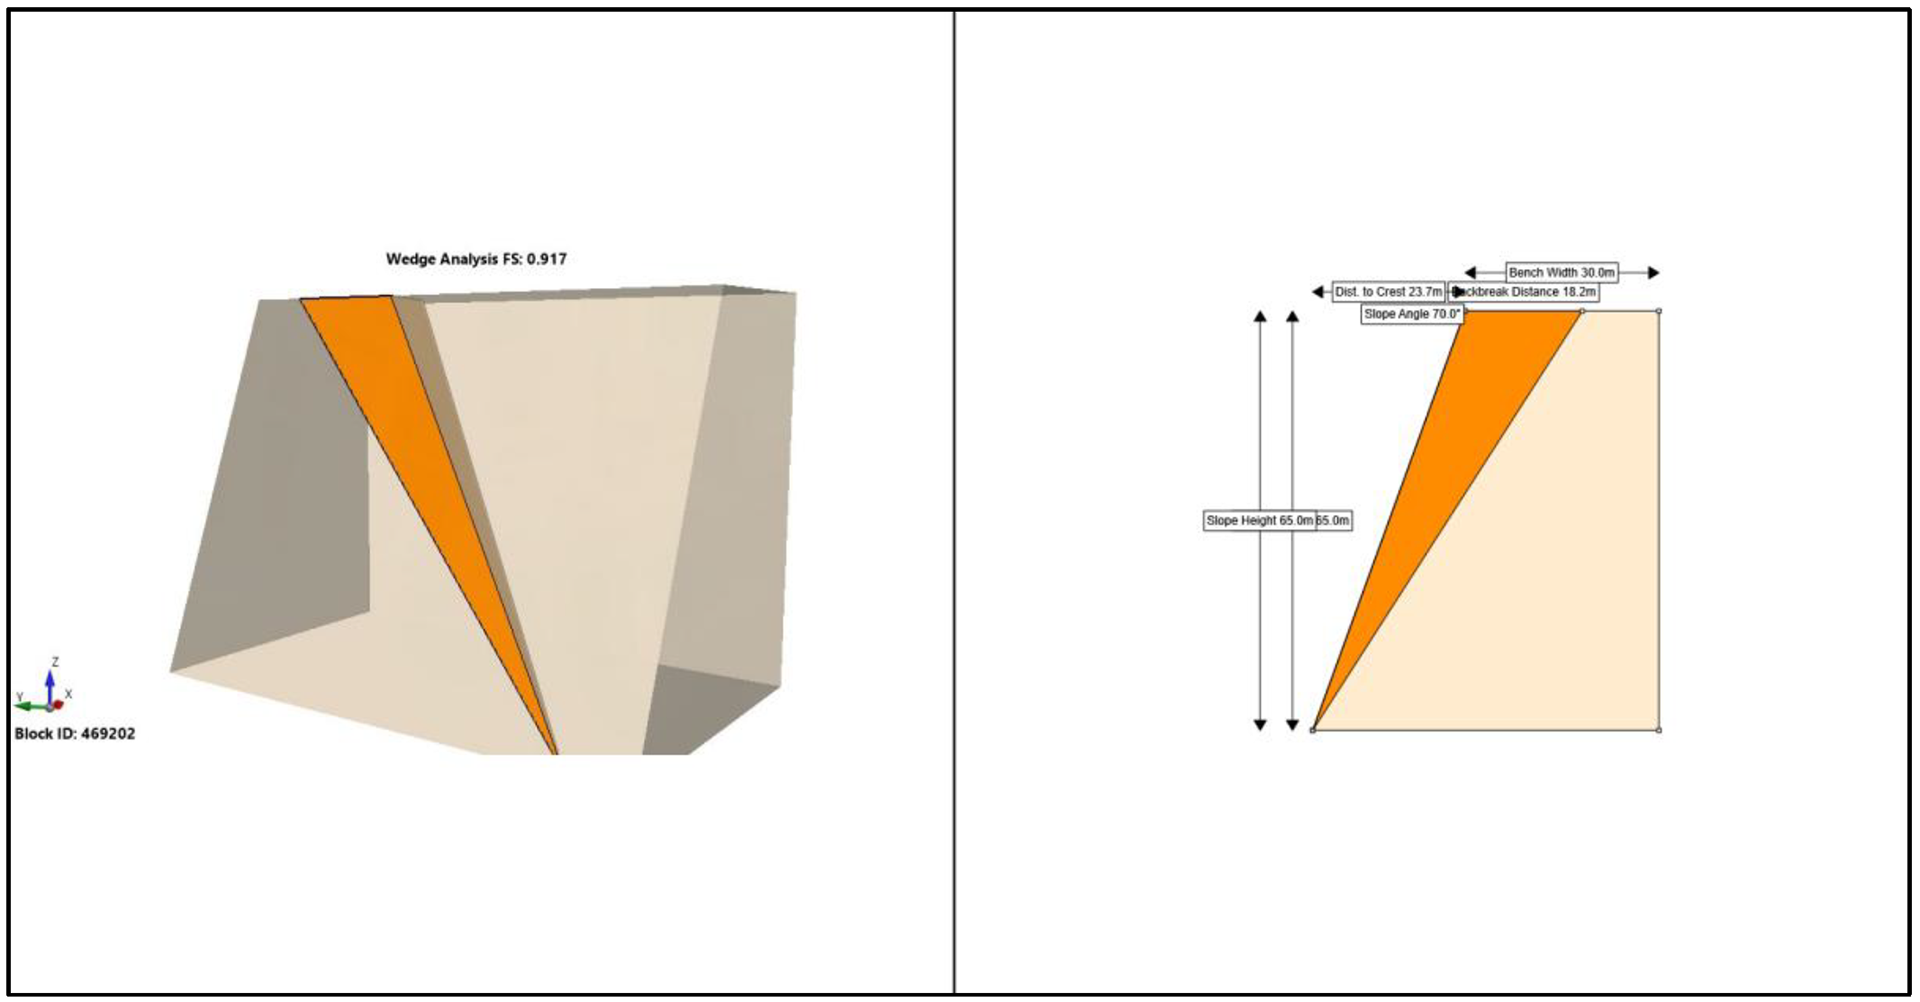
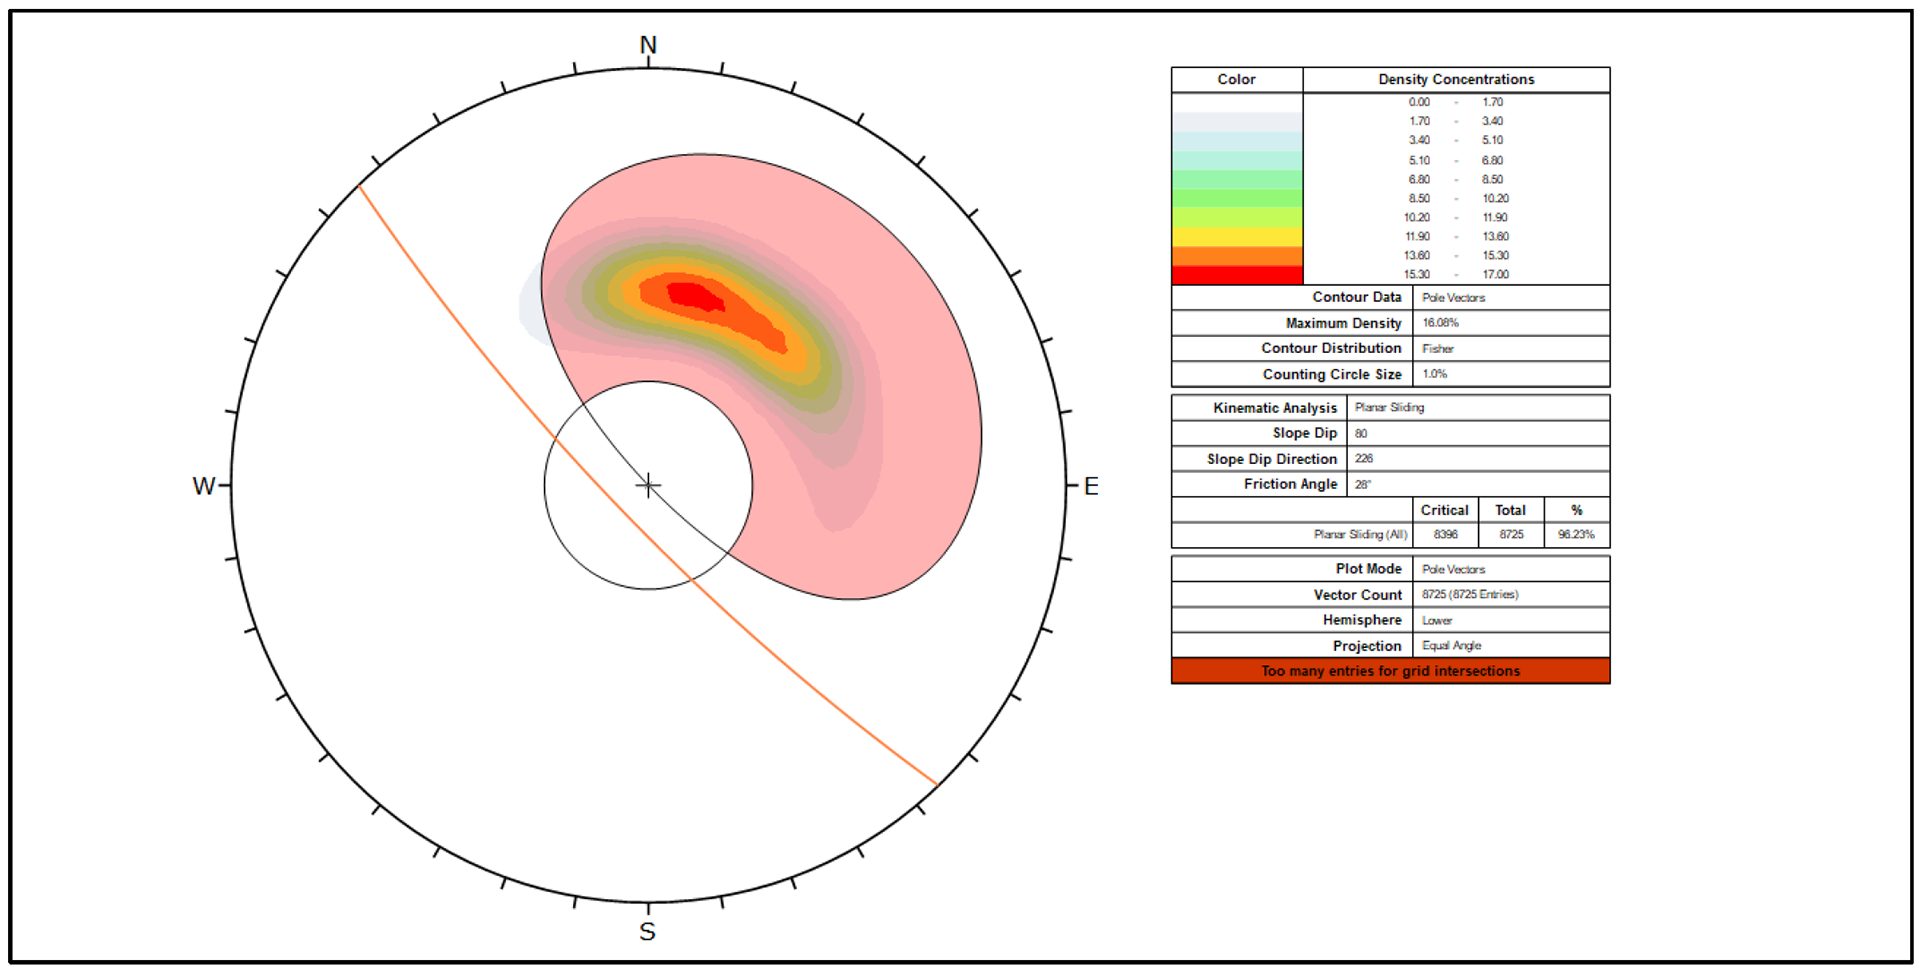
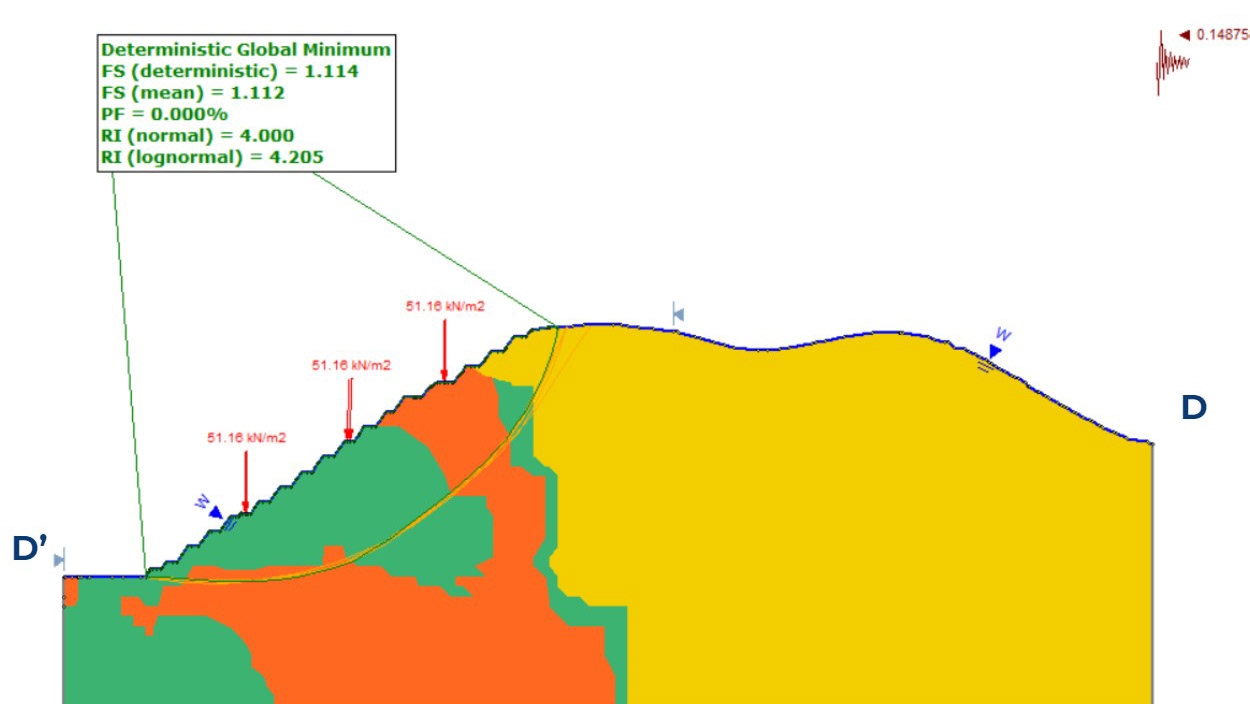
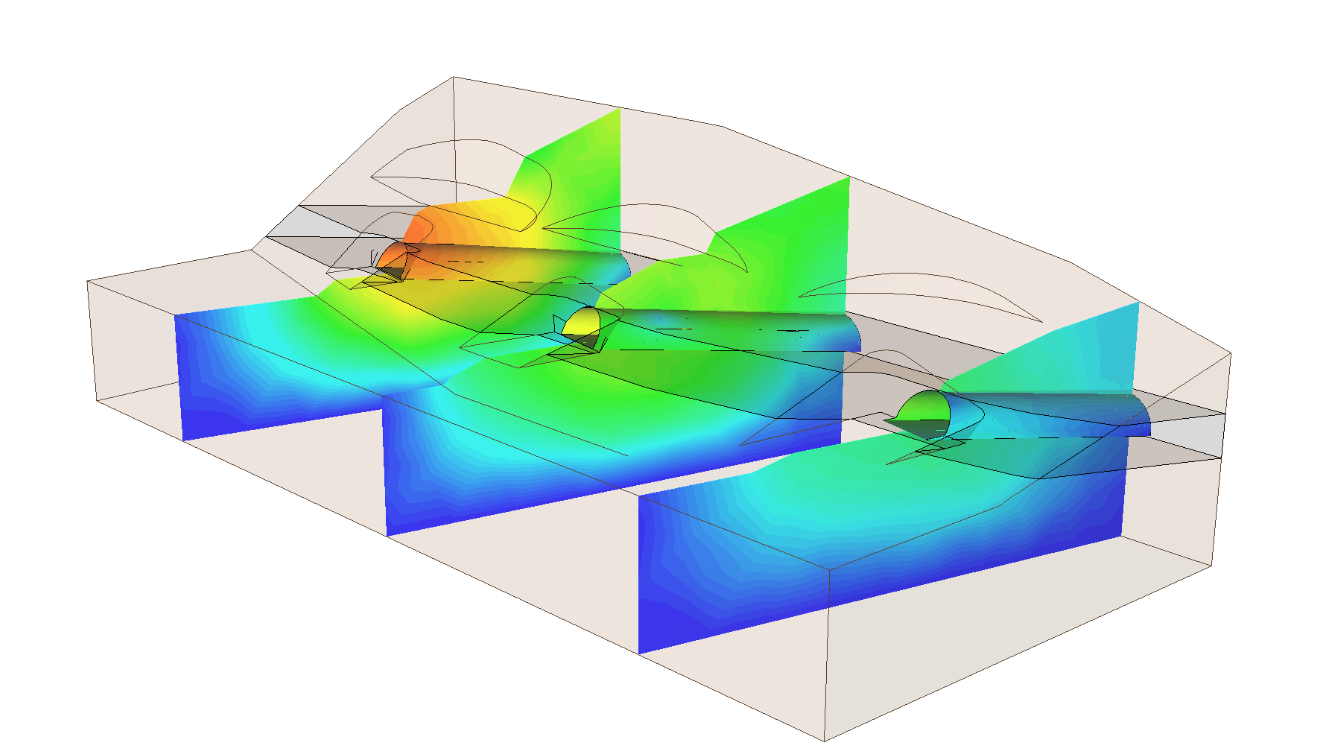
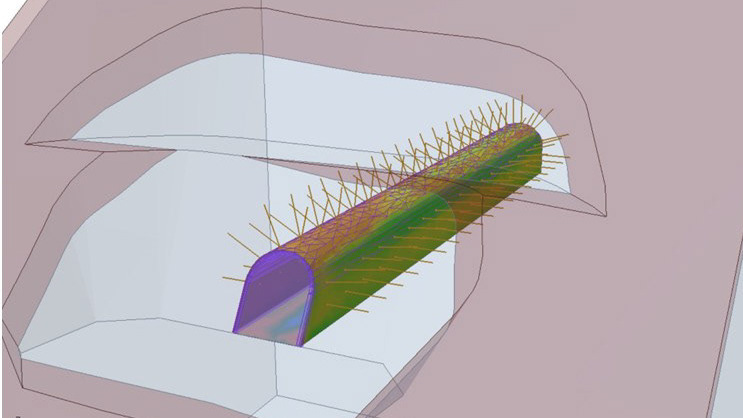
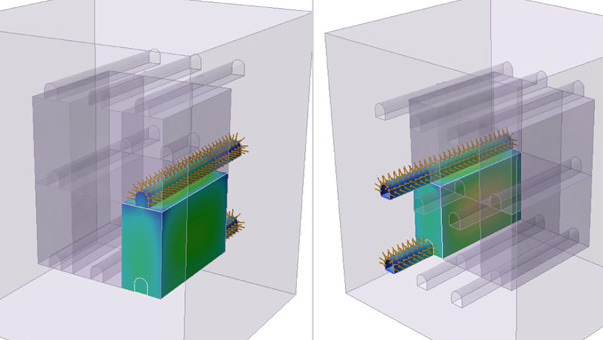
The stereonet results can be further interpreted to assess slope stability under various geological conditions. A kinematic analysis (e.g., using Dips) can be performed to estimate the probability of different potential failure modes, such as planar, wedge, or toppling failures. For a more advanced assessment, the analysis can be extended using joint-based limit equilibrium methods to calculate the Factor of Safety (FK) and identify the dominant failure mechanism with specialized software such as RocSlope².